第 2 章 · 第 1 节Chapter 2 · Section 1 基础Core
2.1 数据到图表的步骤From data to chart
区分数据变换、视觉映射和视图变换,理解交互对各阶段的反馈。Distinguish data transformation, visual mapping and view transformation.
本节要点Key points
- 流程是原始数据 → 数据表 → 视觉结构 → 视图,交互可以反馈到多个阶段。The pipeline runs raw data → data table → visual structure → view, and interaction can feed back into several stages.
- Card 描述管道,Mackinlay 描述映射决策,van Wijk 强调反馈循环,三者互补。Card describes the pipeline, Mackinlay describes mapping decisions, and van Wijk emphasizes feedback. The three views complement one another.
- 同一份数据改变筛选、编码或视图,会得到不同的图。Changing the filter, encoding or view of one dataset produces different charts.
01理解概念Understand the concept
案例
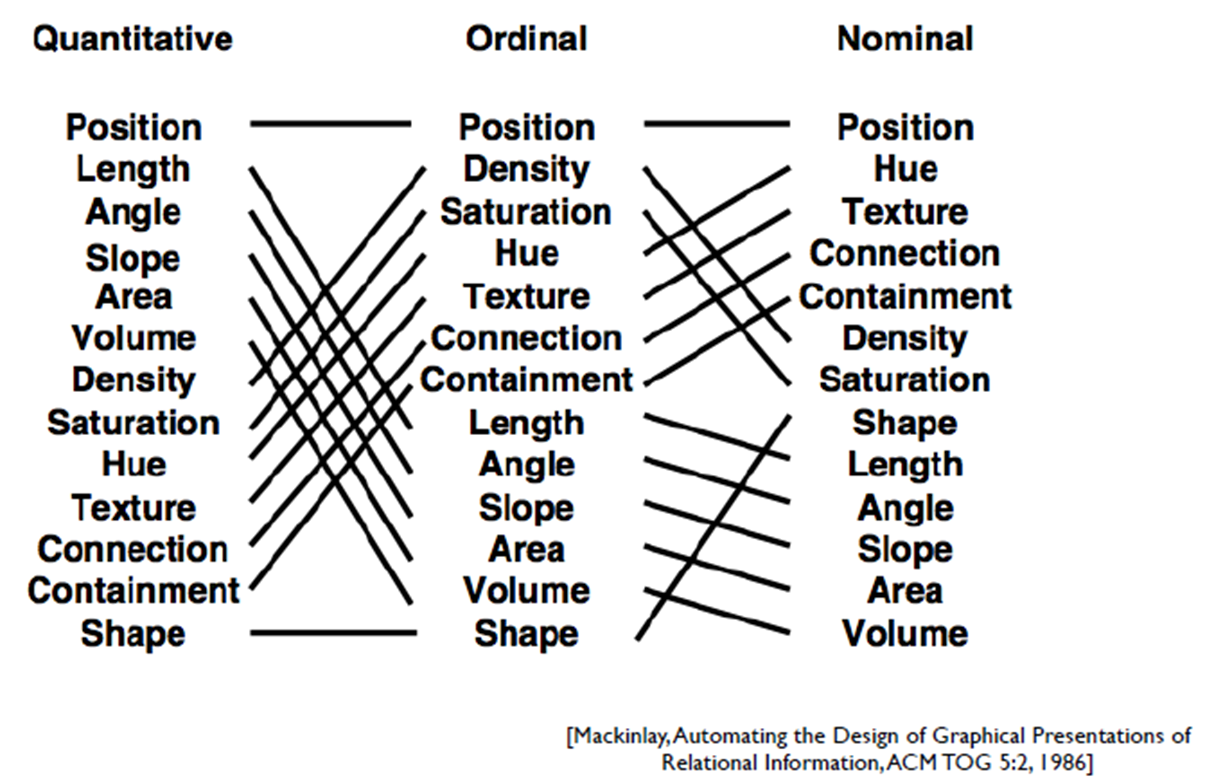
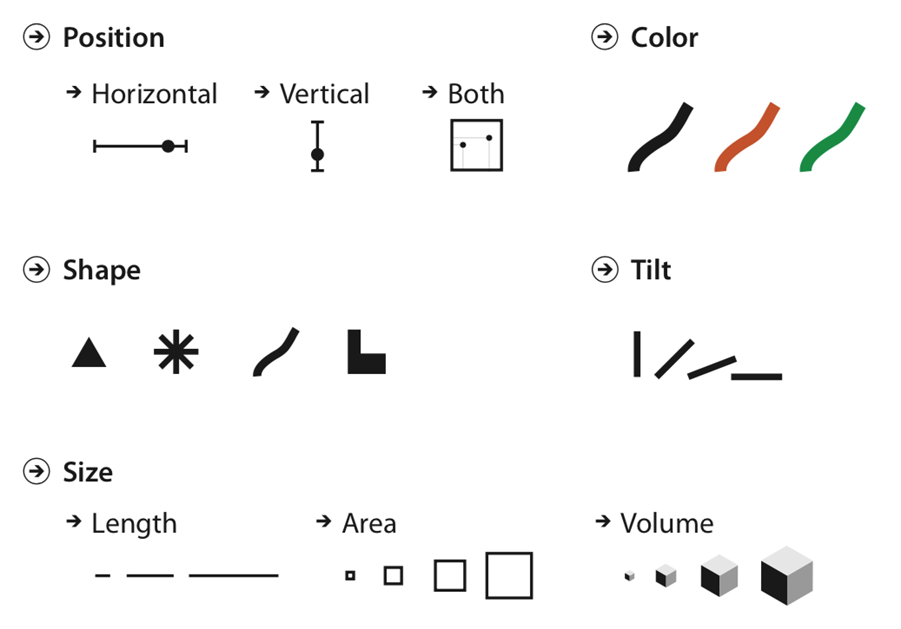
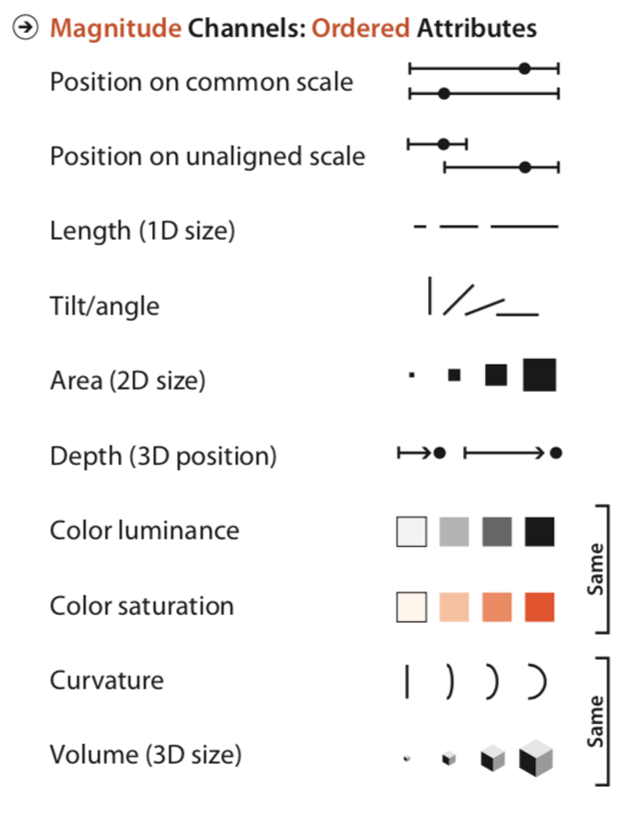
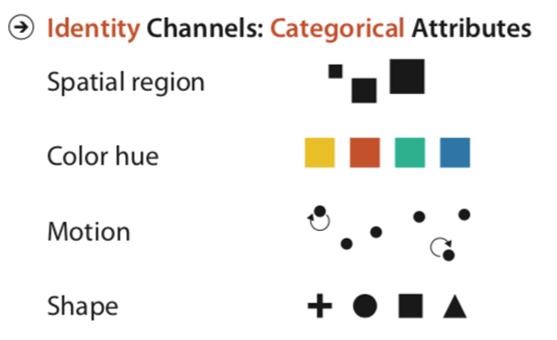
3 个可视化流程模型:① 参考 Card 1999 模型绘制流程图(Box Flowcharts)→ ② Mackinlay 自动化准则 → ③ van Wijk 模型(含交互反馈)。
这张概念图用 D3 重画,每个节点点击后能展开细节。
可视化流程的三个经典模型
| 模型 | 作者 / 年份 | 核心思想 |
|---|---|---|
| Card 数据流模型 | Card, Mackinlay & Shneiderman, 1999 | 原始数据 → 数据表 → 视觉结构 → 视图(嵌套变换 D→T→V→C/L/S) |
| Mackinlay 自动化准则 | Mackinlay 1986 | 对每种数据类型,自动选「量化准确性最高」的视觉通道(如:数值→位置、类别→色调) |
| van Wijk 反馈模型 | van Wijk 2005 | View ⇆ Filter ⇆ Param ⇆ Other Views —— 强调交互反馈循环 |
核心教学要点:三个模型描述同一件事的不同侧面—— Card 给"管道",Mackinlay 给"自动决策",van Wijk 给"反馈环"。 三者是叠加关系,不是冲突关系。
- Card 模型:告诉你"transform 之后该 mapping,mapping 之后该 view"
- Mackinlay:告诉你"mapping 这一步怎么自动决策"
- van Wijk:告诉你"view 之后还要把用户操作 feed 回去"
交互如何影响流程
交互不只发生在最后的视图阶段:筛选会改变参与分析的记录,切换编码会改变视觉映射,缩放和选择会改变视图。把这些操作看成对流程各阶段的反馈,才能解释为什么同一份数据可以产生不同的图。
Case study
3 visualization pipeline models: ① Reference the Card 1999 model for box flowcharts → ② Mackinlay's automation principles → ③ van Wijk's model (with interaction feedback).
This concept map This lesson uses D3 to redraw this concept map — every node expands details when clicked.
Theory: Three Classic Models of the Visualization Pipeline
| Model | Author / Year | Core Idea |
|---|---|---|
| Card Data Flow Model | Card, Mackinlay & Shneiderman, 1999 | Raw data → data table → visual structure → view (nested transformations D→T→V→C/L/S) |
| Mackinlay's Automation Principles | Mackinlay, 1986 | For each data type, automatically pick the visual channel with the highest “quantitative accuracy” (e.g., quantitative → position, categorical → hue) |
| van Wijk Feedback Model | van Wijk, 2005 | View ↔ Filter ↔ Param ↔ Other Views — emphasizing the interaction feedback loop |
Core teaching points: the three models describe different facets of the same thing — Card gives you the “pipeline,” Mackinlay gives you “automated decisions,” and van Wijk gives you the “feedback loop.” They layer on top of each other rather than conflict.
- Card model: tells you “after transform comes mapping, after mapping comes view”
- Mackinlay: tells you “how to automate the mapping step”
- van Wijk: tells you “after view, you still need to feed user actions back”
How interaction affects the pipeline
Interaction is not confined to the final view: filtering changes the records being analyzed, switching encodings changes the visual mapping, and zooming or selection changes the view. Treating these actions as feedback into different pipeline stages explains why one dataset can produce different charts.
02动手实验Try the experiment
试一试:Try this: 逐步选择流程节点,观察相同的合成新生数据如何变成班级人数图,再改变筛选条件。Step through the pipeline and see synthetic student records become class counts, then change a filter.
实验将在进入此区域时加载,需要启用 JavaScript。The experiment loads when you reach this area. JavaScript is required.
Some experiment controls use Chinese labels.
做完后:你应该看到After the experiment: what to look for
03代码与讲解Code and explanation收起 / 展开Collapse / expand +
关键代码 ① SVG 流程图节点 + 箭头
5 个 step 节点横向排列,相邻节点之间用 SVG marker 画的箭头连接。
// 1. 用 <defs> + <marker> 定义箭头
svg.append("defs").append("marker")
   .attr("id", "arrowhead")
   .attr("viewBox", "0 -5 10 10")
   .attr("refX", 8)            // 箭头位置校准
   .attr("markerWidth", 6)
   .attr("orient", "auto")       // 跟随线方向旋转
   .append("path").attr("d", "M0,-5L10,0L0,5").attr("fill", "#94a3b8");

// 2. 用 marker-end 引用箭头(重要)
svg.append("line")
   .attr("marker-end", "url(#arrowhead)")
   .attr("x1", x1).attr("y1", y).attr("x2", x2).attr("y2", y);

// 3. 节点 ↔ 数据 绑定:d3.data + click 事件
svg.selectAll(".node").data(nodes)
   .join("g")
   .on("click", (event, d) => {
     // 关键:classed 是 D3 状态管理核心 API
     svg.selectAll(".node").classed("selected", n => n.id === d.id);
     document.getElementById("d-4-1-detail").innerHTML = d.detail;
   });
关键点解释:
marker-end="url(#arrowhead)" 是 SVG 引用的方式 —— 把 <defs> 里定义的形状"嵌入"到线段末端;
classed("selected", predicate) 接收布尔函数,一次性切换所有节点的"selected"状态,避免自己写 forEach。
Key Code — SVG Flowchart Nodes + Arrows
5 step nodes arranged horizontally, connected by SVG-marker-drawn arrows between adjacent nodes.
svg.append("defs").append("marker")
   .attr("id", "arrowhead")
   .attr("viewBox", "0 -5 10 10")
   .attr("refX", 8)
   .attr("markerWidth", 6)
   .attr("orient", "auto")
   .append("path").attr("d", "M0,-5L10,0L0,5").attr("fill", "#94a3b8");


svg.append("line")
   .attr("marker-end", "url(#arrowhead)")
   .attr("x1", x1).attr("y1", y).attr("x2", x2).attr("y2", y);


svg.selectAll(".node").data(nodes)
   .join("g")
   .on("click", (event, d) => {

     svg.selectAll(".node").classed("selected", n => n.id === d.id);
     document.getElementById("d-4-1-detail").innerHTML = d.detail;
   });
Key explanation:
marker-end="url(#arrowhead)" is SVG's referencing mechanism — it “embeds” a shape defined inside <defs> at the line's end;
classed("selected", predicate) takes a boolean function and toggles the “selected” state of every node in one call, so you avoid writing forEach yourself.
04练习Quiz
学完后,可以标记进度。Mark this section when you finish.